Talking Points:
The New Zealand Dollar was buffeted by a double data miss Retail sales were below expectations for January The manufacturing sector also came up short The New Zealand Dollar was hit early Friday thanks to two economic data misses and the reported views of its central bank. The currency was hit early by an underwhelming performance form the country’s Performance of Manufacturing index for January. This is like the Purchasing Managers Indexes released elsewhere. A number above 50 indicating expansion in the sector, while anything below that means contraction. January’s came in at 51.6, but that was well below the 54.2 chalked up in December. BusinessNZ publishes the index and said that the Christmas holiday break and bad weather conditions may have affected manufacturing performance. Looking on the bright side it said that those survey respondents who mentioned neither factor often reported business as usual. NZD/USD slipped on these figures, and did so again shortly afterward on the release of retail sales figures for the final three months of 2016. They rose 0.8% on the quarter, below the 1% gain expected. The previous quarter’s rise was revised down to 0.8% from 0.9%. The data weren’t all bad. StatsNZ said that eleven of the fifteen retail sectors reported higher sales volumes over the quarter. Still, NZD/USD slipped after this data double whammy. It was at 0.72155 in the aftermath, below 0.72244 before the numbers. Data battered: NZD/USD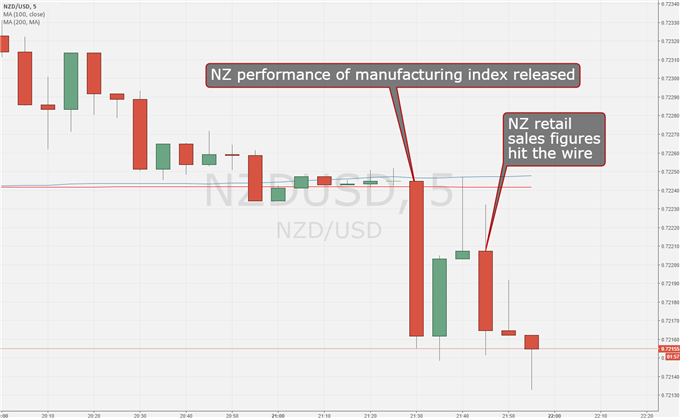 Chart Compiled Using TradingView Some reported commentary from the Reserve Bank of New Zealand crossed the wires as the data came out. They didn’t help kiwi bulls much either. Reportedly a briefing to an incoming finance minister given earlier this year, it said that upward pressure on NZD may be turning, but that monetary policy is expected to remain accommodative. Want to know more about the financial markets? Why not take a look at the DailyFX Trading Guide? — Written by David Cottle, DailyFX Research Contact and follow David on Twitter: @DavidCottleFX
We recommend using RobotFX trading tools.
 Chart Compiled Using
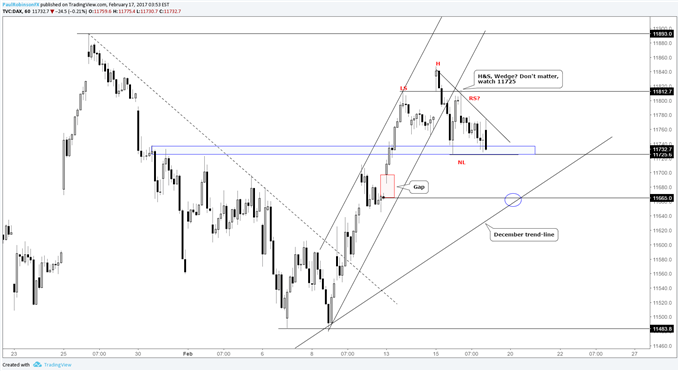
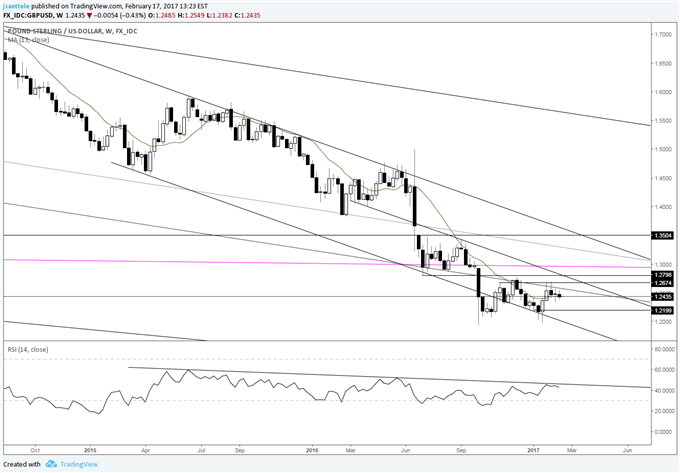
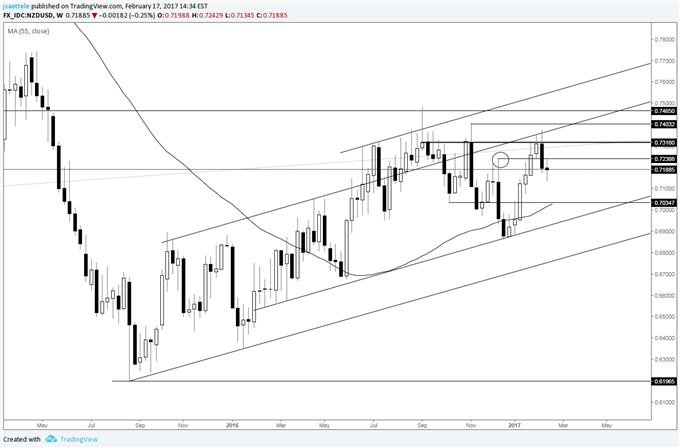
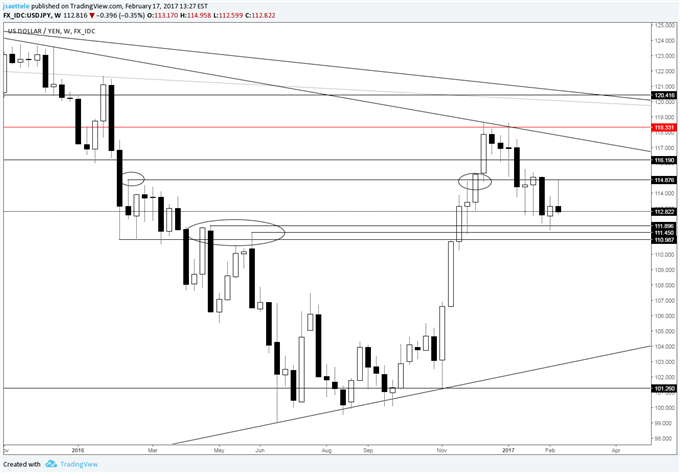
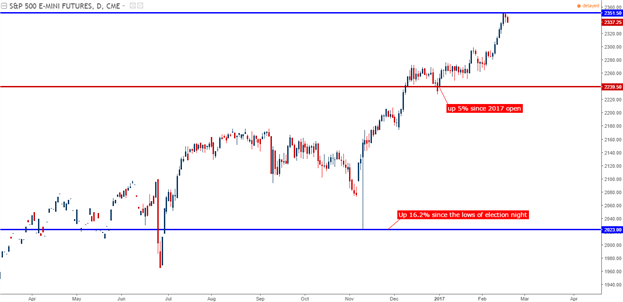 Chart prepared by James Stanley
 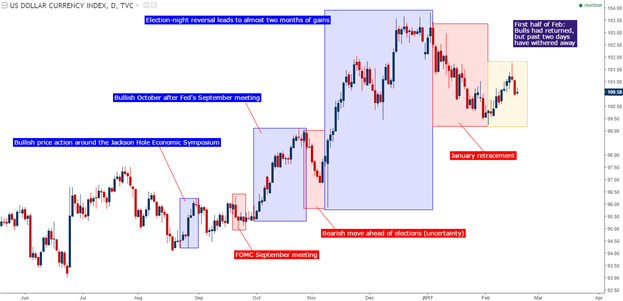 Chart prepared by James Stanley — Written by James Stanley, Analyst for DailyFX.com To receive James Stanley’s analysis directly via email, please SIGN UP HERE Contact and follow James on Twitter: @JStanleyFX